
Farms today operate under the same terrifying unpredictability as they did 100 years ago. Technology changes, equipment changes, but both men and machines remain at the mercy of Mother Nature.
When so much is out of their control, your agriculture clients need to be able to track, monitor, and know exactly where their machines are on their land. Not only that, but how is fuel being used, and is it being wasted? What about the area covered in a day’s work, or when a vehicle urgently needs maintenance?
With telematics, agriculture fleet management gives your clients those answers - more easily and accurately.
What is agriculture fleet management?
Agriculture fleet management is the coordination of all the vehicles, machinery, and movement involved in getting work done across a farming operation. As we’ve seen across our partners' clients' operations, this agricultural management typically involves four interconnected stages:
-
Harvesting
-
Out-of-field removal of biomass
-
Rural road transportation, and
-
Public road transportation.
The corresponding machinery systems for those stages will typically include harvesters, transport units, medium and high capacity transport trucks, and equipment required for unloading.
How POIs made farm vehicle tracking easier
One of our partners approached us with a problem: They had a client in the agricultural sector who needed to track their farming machinery and vehicles. After hearing more about them and analyzing their operating environment, our team configured a custom solution on the 3Dtracking platform that allowed the farmer (or farm manager) to view their farm according to different points of interest (abbreviated as POIs).
These POIs were foundational to the ultimate tracking solution they desperately needed. We defined the POIs around the specific functions and working areas of the farm, so the farmer could easily view and monitor what mattered to their specific operational environment. Not only could they track what they cared about, but they weren’t distracted by other data or functionality that created clutter and caused confusion and overwhelm.
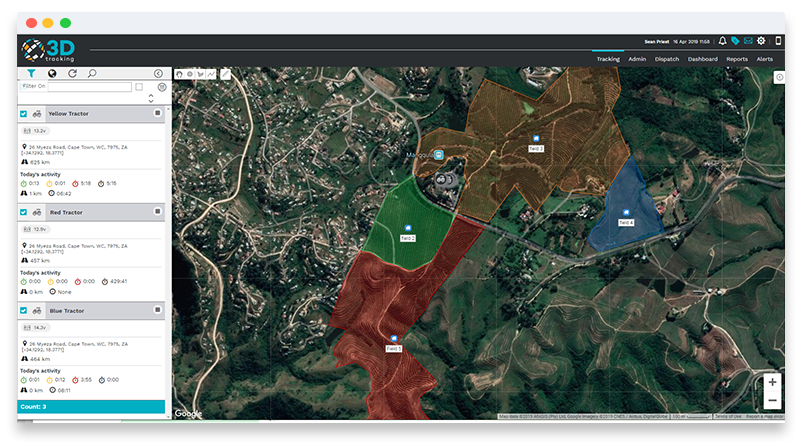
[Above] 3Dtracking platform screenshot showing POIs
What's included in the agriculture fleet management solution
The lasting benefit of this custom solution was that the agriculture company could better understand how efficiently its equipment was being used - or where inefficiencies existed. Through the 3Dtracking platform, they could also see which areas the machinery had already worked on, which areas still needed to be covered, and which areas had not yet been worked on.
But that’s not all. They also received:
-
Real time tracking of any vehicle in the field. When the farmer needed to find a particular vehicle, they could see where it was at any point in the day and whether it was operational in that specific location. No need for phone calls or someone physically checking where a vehicle was.
-
Fuel consumption tracking. This gave the farmer more context around vehicle activity by measuring fuel usage alongside data such as distance covered and working hours.
-
Fuel dispensing monitoring at the farm’s fuel depot, so the farm manager could manage fuel consumption in relation to the actual ‘work’ completed in the fields. This gave them an easier way to control fuel costs and spot unnecessary vehicle idling.
-
Equipment tracking. On our platform, the farm manager can also track the use of certain equipment, such as portable devices or asset trackers, see their location at all times, and receive alerts for unauthorized use of that equipment.
-
Consumables management. If agriculture fleet vehicles, such as a tractor, have a CanBus device installed, 3Dtracking’s platform can receive and display relevant information on oil levels, temperature, fuel levels, speed, RPM, and more.
-
Custom calculations. We developed further calculations to utilize a vehicle’s capability - for example, the area covered by a sprayer. When the sprayer is switched on, that input is registered on the system and shows up on the screen as a thicker tracking line. Taking into account the sprayer width, in relation to location, we can calculate the total area covered when the sprayer was active, and at what fuel cost.
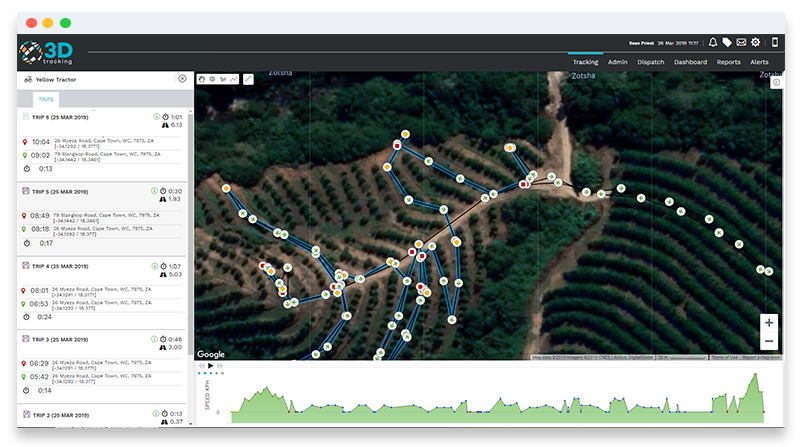 [Above] 3Dtracking platform screenshot showing when the sprayer was switched on (thicker blue line) versus off (thin black line).
Types of alerts and reports for agriculture fleet management
The 3Dtracking platform provides a host of easy-to-use functionality to make agricultural operations easier to track and optimize. Your clients can pull reports on all of the following data and set up alerts so they aren’t blindsided by risks:
Areas covered by vehicles (based on defined POIs).
-
Driver authentication.
-
Working hours.
-
Maintenance activity and history for all vehicles.
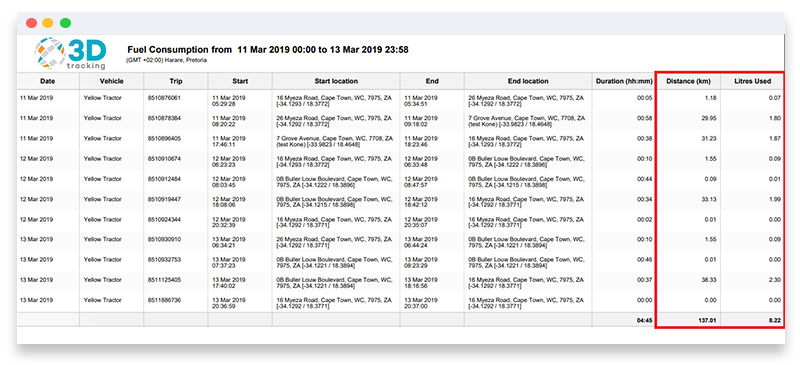 [Above] 3Dtracking platform screenshot showing fuel report
Spend time with any key account manager, or sit in a meeting with our CEO, and you’ll see that a one-size-fits-all approach is very rarely the answer when partners come to us with requests. It’s why we dedicate a lot of time between our teams and our partners (or directly with their clients) to understand the metrics they care about and what they’re ultimately trying to achieve. That’s the only way we can make sure they get the best solution.
If you have agriculture clients or want to expand your offering to serve this sector, send us a message.
Or, book a free demo now, and one of our friendly account managers will walk you through the platform.