

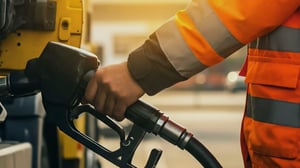
Despite the rise of electric vehicles and multiple green initiatives, the reality is that fossil fuels still power the global economy. Especially in African countries, where, unfortunately, increasing fuel costs hit fleets and communities the hardest.
We recently joined forces with Teltonika to discuss this pressing topic.
Table of contents:
Rising fuel costs are putting fleets in Africa under pressure
Global events, such as ongoing conflict in the Middle East, the attacks on Saudi energy infrastructure, and continued Russia–Ukraine attacks on energy and refining infrastructure, have triggered drastic price increases.
To give you an indication: The average global price of gasoline grew by almost 20% in 2026 compared with last year. Diesel increased by more than 30%¹. However, not all countries are impacted equally by these price increases. The portal Global Petrol Prices conducted a study comparing the cost of a 40-liter tank of gasoline with GDP per capita and found that nine out of the ten least affordable fuel prices are in African countries².
In Malawi, for example, the cost of a full tank of fuel roughly equates to three times the average income. That’s the reality. And while these increases definitely impact the profitability of fleets operating on fossil fuels, they also affect the cost of products and services for local communities.
Prices increase. Everyone feels the pain, in some way or other.
The top 4 industries in the danger zone
We find that logistics and trucking fleets are the most exposed because fuel is one of their largest operational expenses, especially on long-distance routes. Buses face similar pressure because of daily stop-and-go operations and their limited control over charging passengers.
Agriculture, construction, and mining fleets are also vulnerable because of high diesel consumption coupled with remote operations, which makes it difficult to know exactly what’s happening on the ground.
For these industries, fuel monitoring is about business protection as much as it is about visibility.
What factors are influencing fuel consumption today?
Theft is often the reason for unusually high fuel consumption. It costs approximately 100 billion dollars each year globally, and in Nigeria, it costs the economy an astounding $3 billion every year³. If you’re relying on alerts to notify you of sudden fuel decreases, then it’s easier to catch theft.
But losses that happen gradually over time can remain invisible - for example:
-
Losses due to inefficient trip planning and poor driving behavior (because speeding and harsh braking consume more fuel).
-
Losses due to idling or hidden vehicle issues that drain the tank.
All of these factors impact overall consumption in the long run. A telematics platform helps address them if you have, first of all, the right data from the vehicles, but also the right way to analyze it.
“To truly manage fuel consumption, fleet managers need visibility across a broader set of operational factors. That’s how you really zoom into the day-to-day fuel usage of your fleet. That’s where 3Dtracking comes in.” - Irvin Mdluli, Product Owner at 3Dtracking.
How driver behavior impacts fuel consumption
Even small driving habits can have a big impact on a fleet’s fuel usage. Small bad habits tend to snowball and become harder to resolve the longer they continue.
We address this challenge on the 3Dtracking platform with an easy-to-use set of fleet management solutions that help fleet managers understand what’s happening with their fuel consumption:
-
Every trip on the 3Dtracking platform is assigned a driver score.
-
The score provides an overall assessment of driver performance throughout the journey. It takes into account things such as harsh acceleration, harsh braking, and idling, which we all know is a common fuel thief.
-
This view allows fleet managers to quickly identify the drivers or trips contributing to increased fuel consumption. And the aim behind all this data is to empower you (or your clients) to take corrective action immediately.
How to cut fuel costs with CAN data
Fuel data can come from different places: external sensors, such as dedicated fuel-level sensors installed in vehicles, which can give you the vehicle’s fuel level, and a telematics device, which provides data such as location, idling detection, and speeding detection.
But a lot of additional, contextual data - such as engine performance and speed - can also come directly from the vehicle itself by way of the CAN bus. All of this data helps to paint a complete picture of a vehicle’s fuel profile.
How to get CAN data from a vehicle
Teltonika’s 150 series of trackers - FMB, FMC, and FMM 150 - are among the most popular CAN-reading devices due to their flexible connectivity options; it’s up to you to decide whether it should be 2G or 4G, depending on your country, and there’s already a built-in CAN chip for reading the data.
Which CAN bus parameters you receive depends on the vehicle. You can also choose what package of parameters you receive. For example, one package could include fuel level and fuel consumption, while an extended package goes deeper into engine performance by including parameters such as oil level, oil temperature, or engine air intake pressure.
It’s up to every fleet service provider to decide exactly what data they’re interested in.
How to easily turn fuel data into action with 3Dtracking
Having access to all this data is great. But how many different charts and reports can someone realistically look at on a daily or weekly basis? How long will it take them to actually find the value in the numbers?
Real value comes from taking various data sources and analyzing them in relation to each other to extract what makes a meaningful impact on a business.
That is where 3Dtracking excels: presenting all this rich CAN data in an easy-to-read way, so that fleet managers can turn it into actionable insights.
Fuel sensor charts and graphs
Our dual-axis sensor graph tool allows fleet managers to plot two different datasets together. It becomes extremely valuable when users need to compare fuel data against any other sensor available on the vehicle.
On this chart, you can compare the fuel-level data you’re receiving against something else, such as RPM, and identify correlations.
-
For example: If fuel consumption increases significantly while RPM remains consistently high, it could indicate over-revving, inefficient vehicle operation, or, more importantly, something mechanically wrong with the vehicle.
%20(1).png?width=1920&height=1080&name=September%20blogs%20(1)%20(1).png)
Fuel smoothing
When a user clicks any sensor on a unit card in the 3Dtracking platform, they’re presented with a sensor chart. In the case of a fuel percentage sensor chart, a user can see all the fuel data received from this specific device within a certain time period.
Layered on top of that is the fuel smoothing chart. This chart relies on our powerful algorithm to smooth out the sensor fuel data, removing unnecessary ‘noise’ that could stem from a vehicle traversing uneven terrain and making it easier for fleet managers to focus on the actual fuel spikes requiring action, instead of false alerts.
Trip data and context
Each trip on the 3Dtracking platform provides a trip ‘drill-down’. This is a point-by-point account of every point in the vehicle’s journey throughout its trip, and for every point sent by the device to our platform, we link it to the relevant sensor data.
For example:
-
Click a particular point, and you see that we received fuel sensor data in terms of fuel percentage. You can also see the RPM, battery level, and any other sensor data that is available. But you don’t only see it in the trip drill-down.
-
Live on the map, you can go to an exact point in the trip and see the actual fuel sensor data reported at that specific point. This is also accompanied by a trip playback screen that allows you to see the speed of the vehicle throughout the entire trip, aligned to the actual Google road speed.
Together, the ability to see a specific point in the trip and the actual fuel data at that point gives fleet owners the situational context around the data they’re receiving.
Driver scoring
Every trip within the 3Dtracking platform is assigned a driver score. A driver might score 88% for a particular trip, which then indicates that overall driver behavior for this specific trip was good. But it’s possible to go deeper into the score and find out why the percentage is high (or low).
.png?width=1920&height=1080&name=September%20blogs%20(4).png)
A trip contains a breakdown of all driving events related to the trip. These include acceleration, braking, harsh turning, an accident, speeding in low-, medium-, or high-speed bands, and, of course, idling. Every driving event our platform records is assigned driver points. Those points then add up to give you an overall trip score calculation.
“You can see how granularly we go into every event, giving you a strong perspective on what actually happened. All of this can be broken down in a way that allows you to make informed decisions when coaching drivers, specific to an individual driver’s needs.” - Irvin Mdluli, Product Owner.
KPI profiles
Driver scoring is unique to each business and/or industry. 3Dtracking does not offer a one-size-fits-all driver scoring model.
A business can define the speed bands for its own operations, set the minimum idling time and minimum speeding time, assign how many points should be deducted per incident for a specific driver violation, and even exclude specific POIs from the scoring model.
In a mining environment, for instance, businesses face stringent compliance rules around driver speed when vehicles are within a mining site. So, a mining operator would want to set up what is determined to be a low-speed band, gauged against the road speed limit.
-
For example: Low could be 0 to 18, medium 18 to 21, and high could be anything over 21 kilometers per hour or miles per hour.
-
For example: If a low-speed band event is happening within one of your depots, perhaps you don’t want that to form part of your scoring model.
-
For example: If you’d like acceleration to deduct five points and harsh braking to deduct three points, you can fine-tune your KPI profile to align specifically with your vehicle type or the industry you work in.
Fuel log
3Dtracking’s fuel log is ideal for fleet managers trying to establish a single source of truth.
A fleet manager can spend hours trying to reconcile fuel transactions and still encounter discrepancies. They might be recording receipts in Excel and through a fuel card management system, and they could be receiving receipts from drivers in different formats and styles.
A telematics platform gives fleet managers back those painstaking hours and increases the accuracy of all refueling events. If a fuel transaction comes in saying the refueling event was for 100 liters, they can glance at the platform and say, “Wait a minute, this actual refueling event wasn’t 50 liters; it was 20 liters.”
-
They can link actual fuel transactions based on receipts with what is actually happening on the ground.
-
They can link their fuel log with actual refueling events, and include the odometer reading at the time of refueling.
-
They can include the fuel type, how many liters the refueling event involved, and the actual cost per liter.
Fuel reports
Our partners love the customizability of our reports. Users can specify which sensor they want the report to pull information from, but also define the columns available, the specific grouping, and how the information should be aggregated in the report.
They can then select which fields are available in the report, and choose whether they want start and end volumes, liters used, or even correlate that information with fuel tank size.
All of this is available within the report and can be configured to align with the data you want to reveal.
-
For example: One event might show that a vehicle’s start volume was 21, the end volume was 47, and the liter increase was therefore 26. But with the fuel log, a fleet manager can then correlate this actual refueling event and see where it took place.
If a fuel transaction says the refueling happened at a particular service station or fuel station, it’s easy to go back and fact-check this directly from the report. You can see whether that was actually the case and check the actual increase in volume to determine whether it correlates with the fuel receipt the driver handed over.
How to monitor fuel theft with the 3Dtracking platform
But one of the biggest problems, or biggest sources of loss, that fleet owners face is fuel theft. The 3Dtracking platform offers a host of tools specifically to address this problem:
-
Fuel sudden decrease reports make it easier to monitor fuel drops across selected vehicles and sensors, define what counts as a significant decrease, filter out minor fluctuations and false alarms, see where fuel decreases occurred together with the recorded volume change, and schedule reports to run.
-
Fuel alerts for sudden fuel decreases and refills, see the vehicle, sensor, fuel quantity change, and location linked to each event, and act on unusual fuel activity as it happens.
-
Customizable dashboards to monitor fleet activity and trends visually, track driver behavior factors that affect fuel consumption, and compare the most relevant fleet metrics without putting everything into one view.
%20(1).png?width=1920&height=1080&name=September%20blogs%20(2)%20(1).png)
Frequently asked questions
Can the dashboard show fuel refills, fuel theft, and fuel consumption?
Yes, you can select fuel-related parameters such as refills, fuel theft, and fuel consumption to monitor on the 3Dtracking dashboard. Please note the dashboard itself does not work independently of the reports.
Can you compare different types of sensor data?
Yes. Our dual-axis sensor graph allows you to select any set of two sensors, and it is not limited to fuel alone. For example, you can correlate temperature sensor data with speed or any other sensor data you’d like to combine on the dual-axis sensor graph.
You can choose the parameters based on the information you’re looking for.
Can you compare fuel consumption on a particular route with a specific driver?
Yes, you can see which specific routes a vehicle traveled and correlate that with the fuel consumption from that route using a combination of reports on the 3Dtracking platform.
You would create a specific route, and once a vehicle has traveled that particular route, you can save the route. Once you’ve given that route a specific name, you can run a trip summary report.
Within that report, you can see which route the vehicle took, and parameters such as fuel can form part of the information you derive from it.
Is the 3Dtracking platform limited to specific Teltonika devices?
We’re a completely device-agnostic platform. We support more than 1,000 devices, and Teltonika is our primary supplier.
If you get in contact with one of our key account management team and there is a device we don’t support, our team will work to ensure it’s available on the platform.
Can the platform manage vehicles with multiple fuel tanks?
Yes, the 3Dtracking platform supports dual tanks. You can immediately see the quantity of fuel in the different tanks on the unit card. It doesn’t matter what the different tank sizes are; you can separate them in terms of how you look at them on the unit card. For example, tank one may have 50 liters and tank two 100 liters.
Does 3Dtracking support video telematics?
Yes, we support video on our platform. You can go to the unit, request video events, download those video events, and live stream directly from the camera within the unit. Correlating that with actual fuel data would have to be linked through reporting on our platform.
Does 3Dtracking support other fuel-level sensors?
Yes. We support CAN, probes, and ultrasonic sensors. If sensor data comes from a supported Teltonika device, we can pick it up.
In fact, we recently met with a partner from Ghana who is getting impressive results on our platform correlating the data points from both CAN and probes.
Can CAN fuel level data and FLS data be used together?
Yes, it’s possible from both a hardware and platform perspective. Teltonika devices support Bluetooth fuel level sensors from different brands, as well as sensors through an RS232 port, and if the device is integrated with the 3Dtracking platform, then we can serve any data.
Does 3Dtracking provide API access?
Yes, we provide a very comprehensive list of APIs covering location, sensor data, and more. Many of our partners use our APIs for custom integrations.
Does 3Dtracking support MQTT brokers?
No, currently we don’t support brokers through MQTT. But through our APIs, you can subscribe to some of the data on our platform.
%20(1).png?width=798&height=300&name=September%20blogs%20(1720%20x%20900%20px)%20(1).png)
References:
-
GlobalPetrolPrices.com. (n.d.). Energy prices around the world. Retrieved September 18, 2026, from Energy prices around the world | GlobalPetrolPrices.com
-
GlobalPetrolPrices.com. (n.d.). Gasoline affordability around the world. Gasoline affordability around the world | GlobalPetrolPrices.com
-
Suki Patel. (2026, 02/12). Fuel Theft Statistics. Worldmetrics. Fuel Theft Statistics: 2026 Market Report